- import numpy as np
- import matplotlib.pyplot as plt
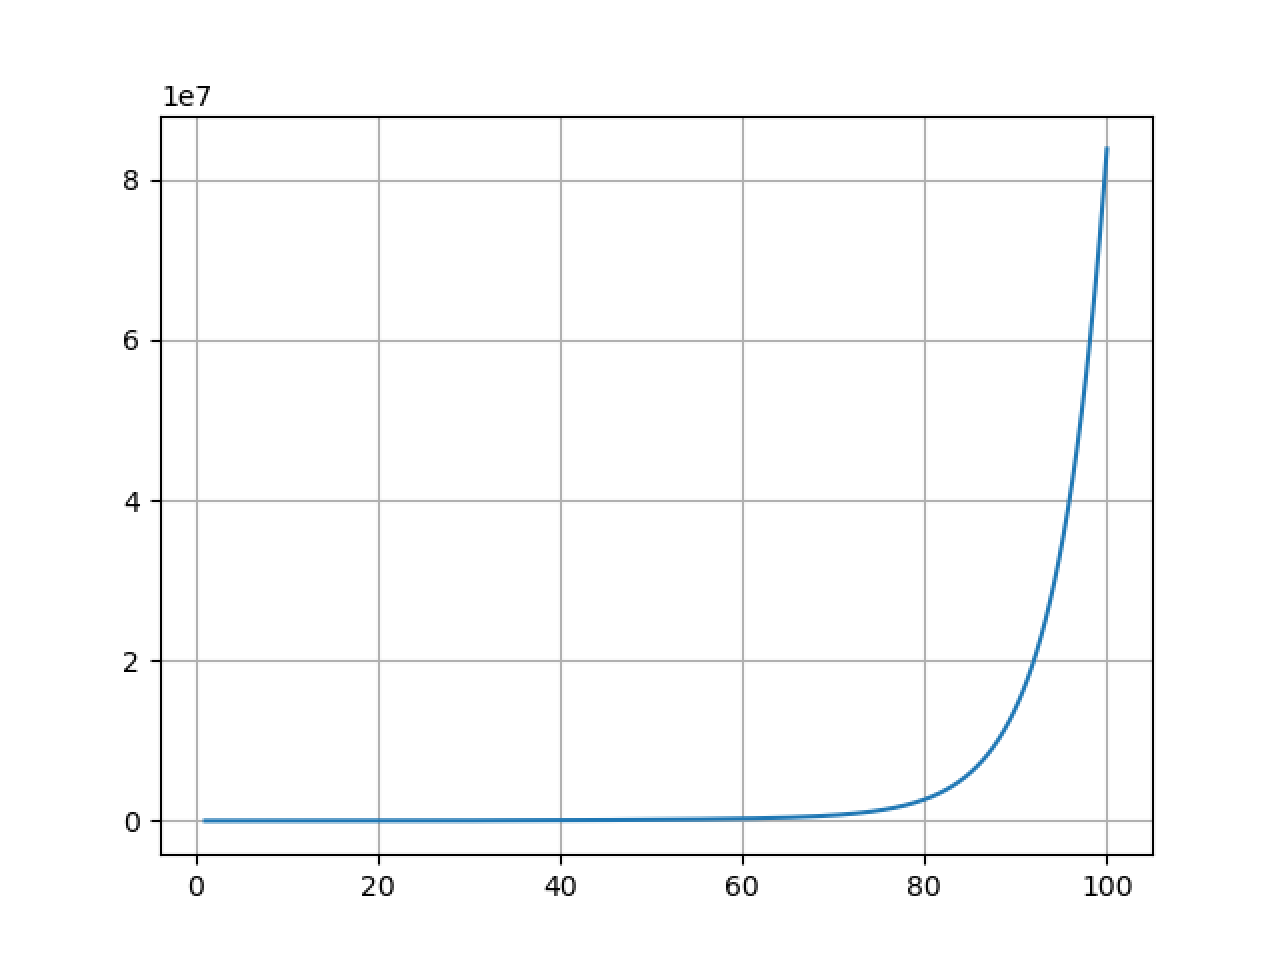
- def f(x):
- return x*x*x+2*x+1.2**x;
- def plot_f():
- x = np.linspace(1,100,1000)
- y = f(x)
- # plt.figure()
- plt.plot(x,y)
- plt.grid()
- plt.show()
- plot_f()
- import numpy as np
- import matplotlib.pyplot as plt
- def f(x):
- return x*x*x+2*x+1.2**x;
- def plot_f():
- x = np.linspace(1,100,1000)
- y = f(x)
- # plt.figure()
- plt.plot(x,y)
- plt.grid()
- plt.show()
- plot_f()
发表评论